Canva also has graphing capabilities built into their website. So now, you can ask students to create a graphical version of their research results.
This is also a great way to teach data visualization from an earlier age.
Great for the math classroom or any classroom involving:
- Use of surveys
- Polls
- Interviews or statistics
- Present key findings using graphics
- Great for the science fair
- Creative form of a lab report
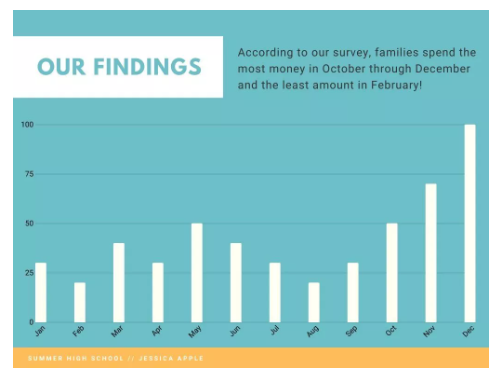
Example: